

Air quality is a major concern nationally and in certain areas of Chippenham we are no exception. With the ongoing future development of more housing in the town we have concerns that the problem will continue to get worse. Air quality is a health and climate emergency which is why we have fundraised to support two projects to tackle this. Both projects involve collection of data and highlighting the dangers to tackle this in our community.
Fundraising Complete
Our Air Quality monitoring project was somewhat thrown off track by the pandemic. Pre-Lockdown we had completed our first step and raised the all important funds to commence air quality monitoring in the town. We had identified three sites that would be suitable for monitoring.
A title
Image Box text
Location
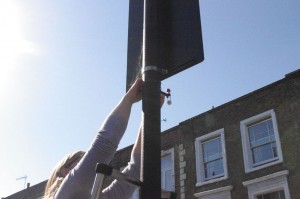
We had received external expert advice on position of the monitors to ensure they are providing useful data. We consulted Wiltshire Council for their own methodology and were procuring the diffusion tubes ready to be positioned in the town.
Robust Data
The intention was the data itself would be collected monthly, over a period of a year and samples from our monitors lab tested in special air quality testing facilities to produce robust data.
Transition to Clean air
The data will be used to highlight the reality of our air quality in Chippenham to our fellow residents and also approach policy makers to consider making appropriate changes to planning and other investments to ensure there is a sensible transition to zero carbon and clean air in future.
Restarting the Air Quality Project
We are looking for volunteers to restart this project post pandemic. If you are interested in this project and want to volunteer your time or expertise to help us please get in touch.
In the meantime we have a Beta Environmental Dashboard measuring PM 10 and PM 2.5 particulate pollution, humidity, temperature, air pressure and noise on Langley Road, Chippenham.
Read more below…
A title
Image Box text
Beta Air Pollution monitoring and live Environmental dashboard
Location
The beta air pollution monitoring is on Langley Road, Chippenham. It has been installed as a relatively low cost citizen science project (£75). This is many times less than the cost of a fully calibrated system. It does however provide interesting information and measurements. However it would be difficult to use the data as policy evidence unless a calibrated control was used.
Validity of Data
Whilst not a lab calibrated system the PMSA003 sensor used to measure PM10 and PM2.5 particulate pollution has been field evaluated in a study here
It has been showed to have an R squared correlation of 0.83 to 0.90, with 1.0 being the ideal. For high relative humidities > 75% a bias of +14.7% has been noted in the study. Hence the RH sensor data is shown next to the measurements for comparison.
The Equipment
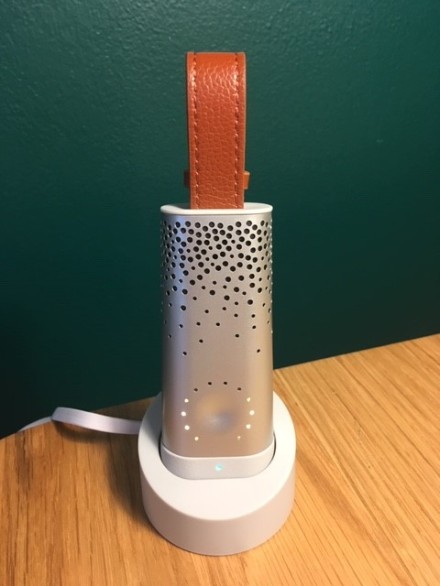
The project is based around the Raspberry Pi Pico W board, and in particular the Pimoroni Enviro Urban kit found here.
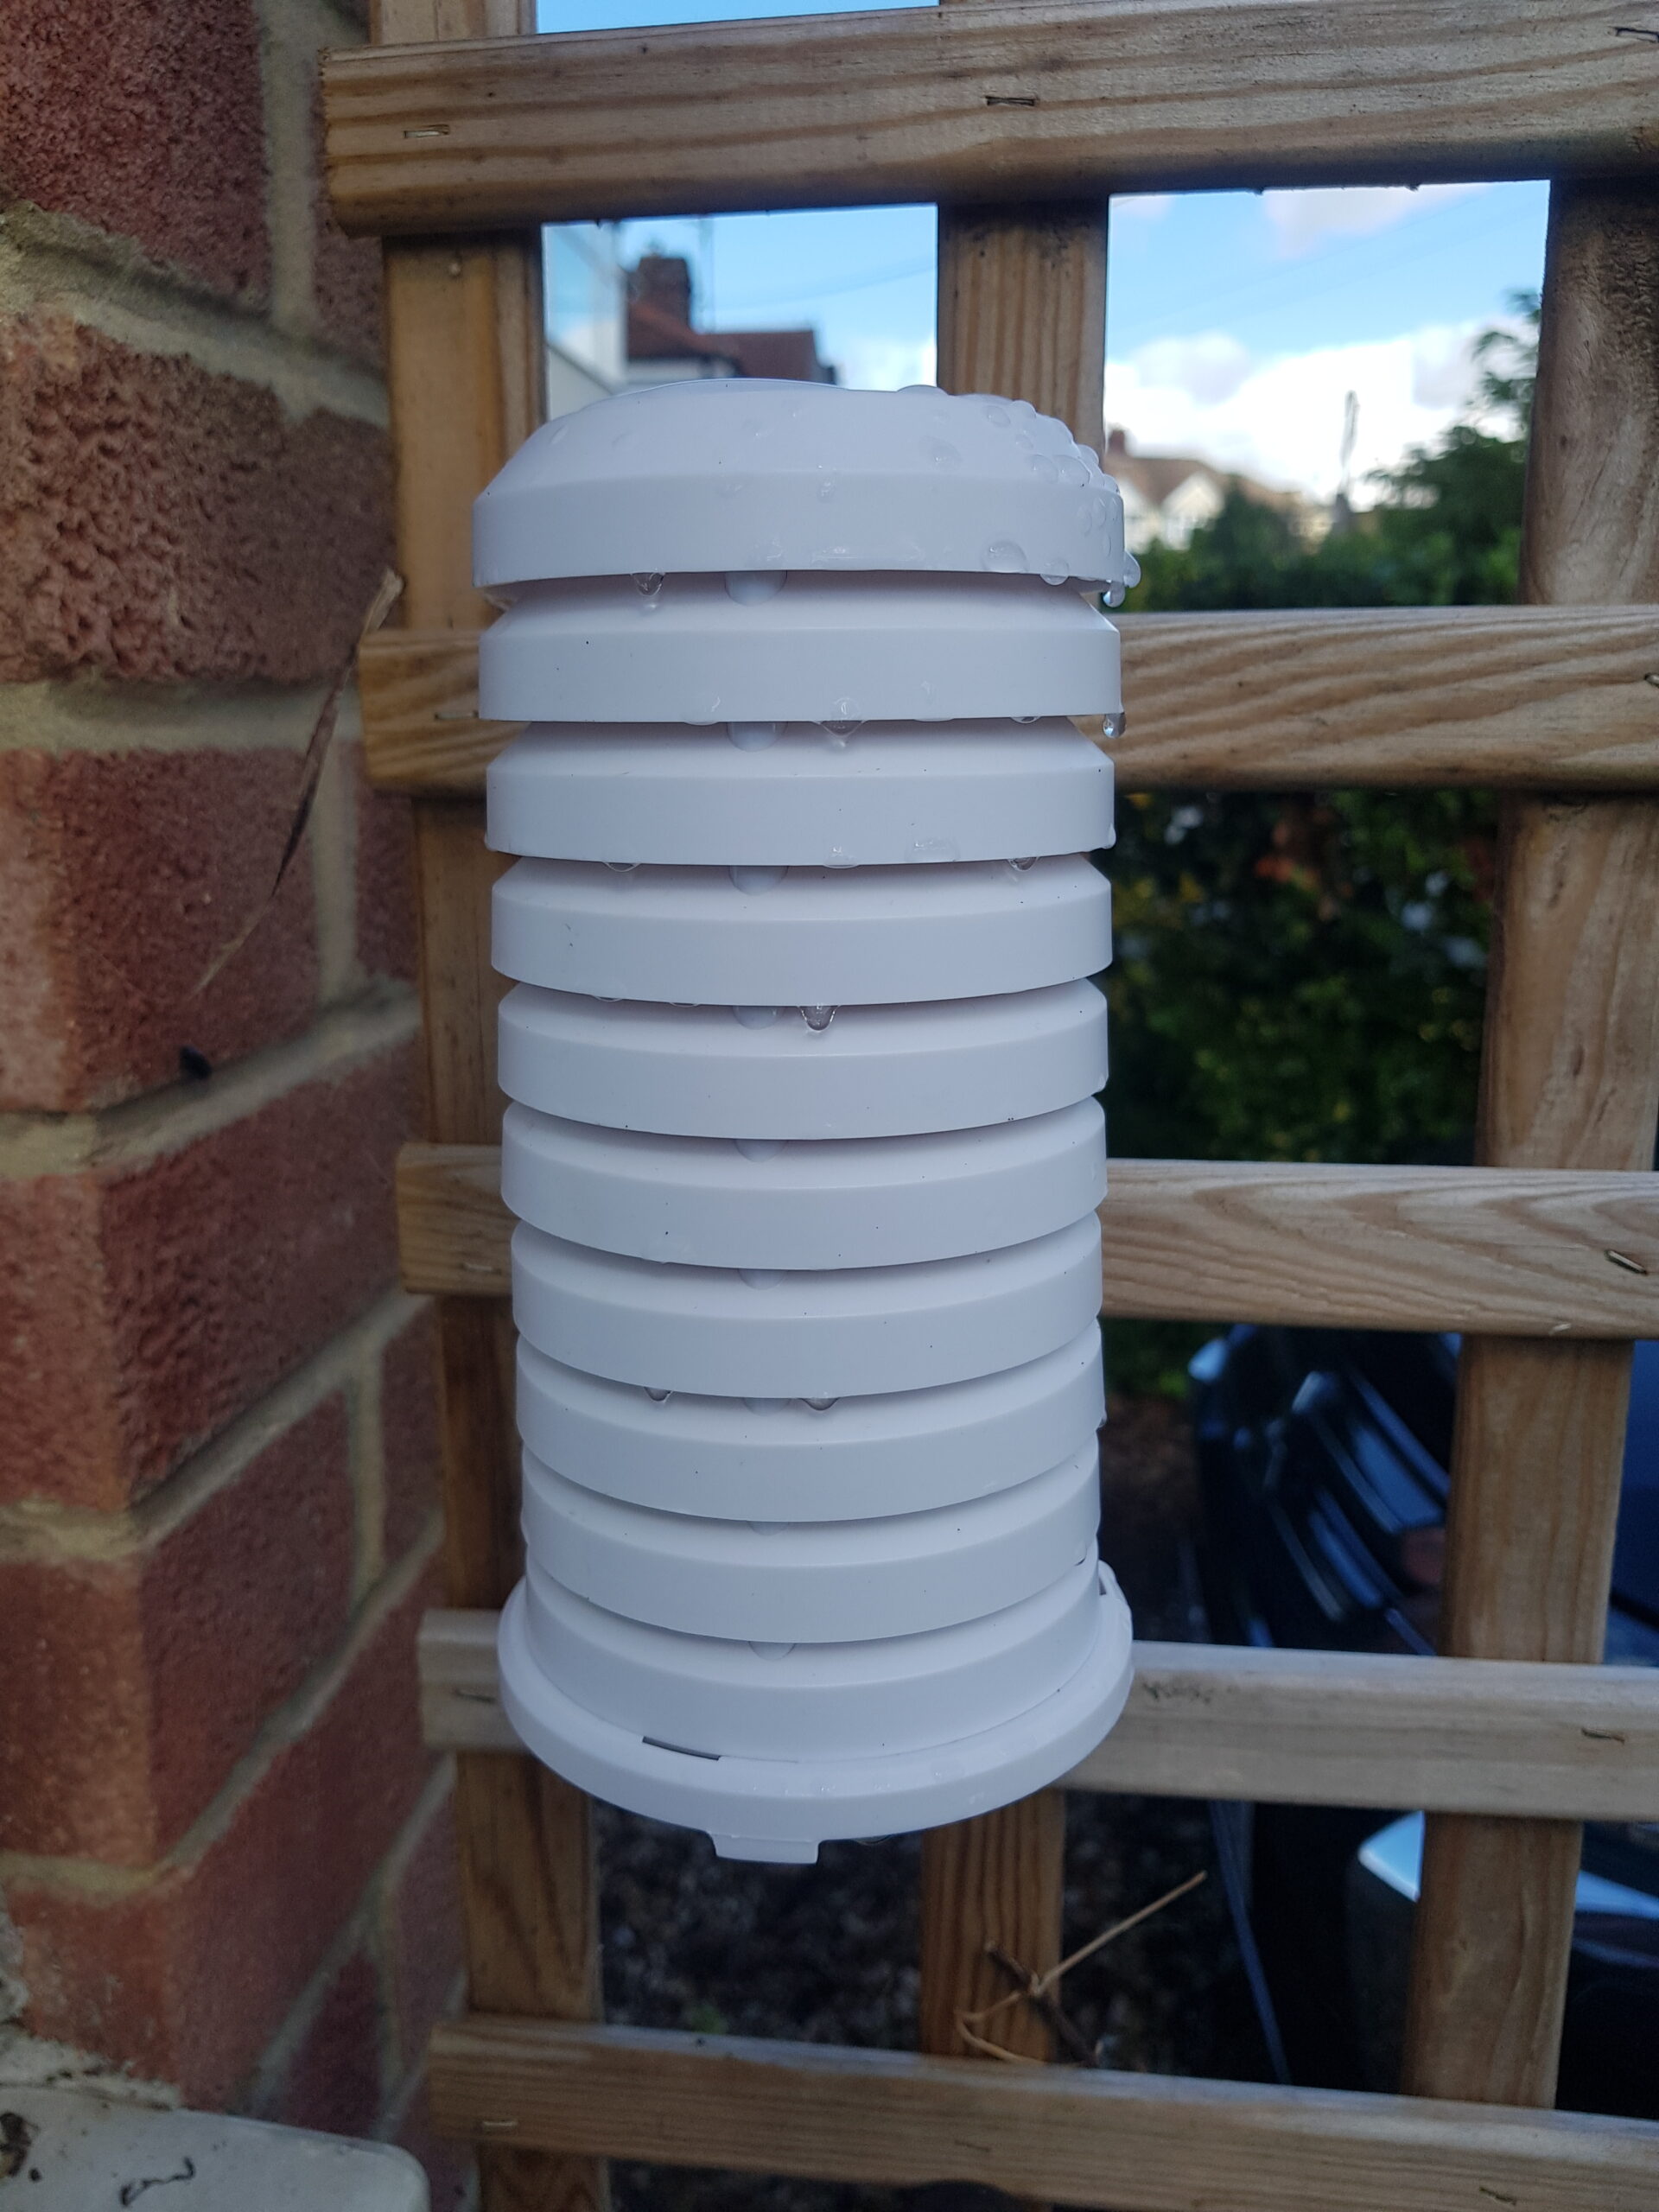
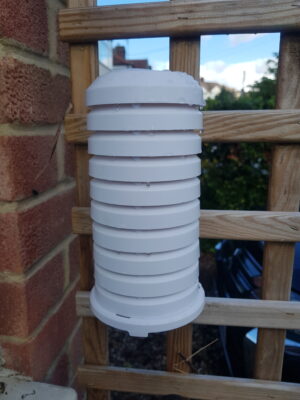
The Pico Pi and Sensors are battery powered and sit in a weather proof Stevenson Screen mounted at approx 1m high and 5m from the main road in a front garden. Measurements are automatically taken every 15 minutes and uploaded over wifi once per hour to the adafruit.io cloud server.
See the live Environmental dashboard
You can click on the button below to visit the external adafruit.io website dashboard where the live environmental data is uploaded. Note it will open in a new window.
Caveats: Though the sensor has shown good correlation with laboratory calibrated sensors, it is not a laboratory calibrated sensor. It is known to read up to 15% high in relative humidities greater than 75%, hence particulate readings are shown next to the humidity reading to allow some context.
A title
Image Box text
What Particulate Levels are acceptable?
What are Particulates?
PM 10 Particulates are small particles less than 10 micometres in diameter (10 to the power -6 of a metre). PM 2.5 Particulates are less 2.5 micrometers in diameter.
They consist of non gaseous particles in the atmosphere that can enter the blood stream lodging in the heart brain and other organs. Particulates are of considerable concern to human health.
What are the limits?
The Air Quality Standards Regulations 2010 require that concentrations of PM in the UK must not exceed:
- An annual average of 40 µg/m3 for PM10;
- A 24-hour average of 50 µg/m3 more than 35 times in a single year for PM10;
- An annual average of 20 µg/m3 for PM2.5.
World Health Organisation
The WHO has set tighter limits for particulates. The current guidelines state that annual average concentrations of PM2.5 should not exceed 5 µg/m3, while 24-hour average exposures should not exceed 15 µg/m3 more than 3 – 4 days per year.
PM10 (particulate matter with a diameter of 10 microns or less) concentrations of 15 µg/m3annual mean, 45 µg/m3 24-hour mean.
Air Quality Latest News and Updates
Beta Environmental Dashboard launched
As part of our aim to monitor and improve Air Quality in Chippenham we’ve launched [...]
Sep